Graph CNN based Multi-motion Visual Odometry
This project uses the graph convolutional neural network to transform the removal of dynamic feature points into a two-class anomaly detection problem with unbalanced samples, and uses the back-end spatio-temporal dual-track VO to estimate the movement of the instance and the camera.
In order to solve the motion of the camera and the rigid body, it is necessary to classify the trajectories of feature points with different motion consistency in the space. Among them, the classification method that only relies on the geometric features of the trajectory has nothing to do with the semantic information of the moving rigid body and can adapt to different transformations in the unknown environment, and the classification effect of feature points is not limited by the algorithm accuracy of semantic detection and semantic segmentation. In the research history of multi-motion visual odometry that only relies on geometric features, researchers usually need to apply clustering algorithms to all trajectories or classify them through RANSAC iterative optimization methods. This type of method requires multiple iterations to output high-precision classification results, consumes a large amount of computing power, and causes slow calculations.
In response to this problem, this paper improves on the graph convolutional neural network and designs an end-to-end dynamic trajectory classification algorithm. And we changed the goal of multi-motion trajectory segmentation from clustering all trajectories to clustering only dynamic feature points. Compared with the geometric MVO algorithm of SOTA (state of the art), the algorithm in this paper has higher accuracy. And there are more than ten times improvement in real-time performance.
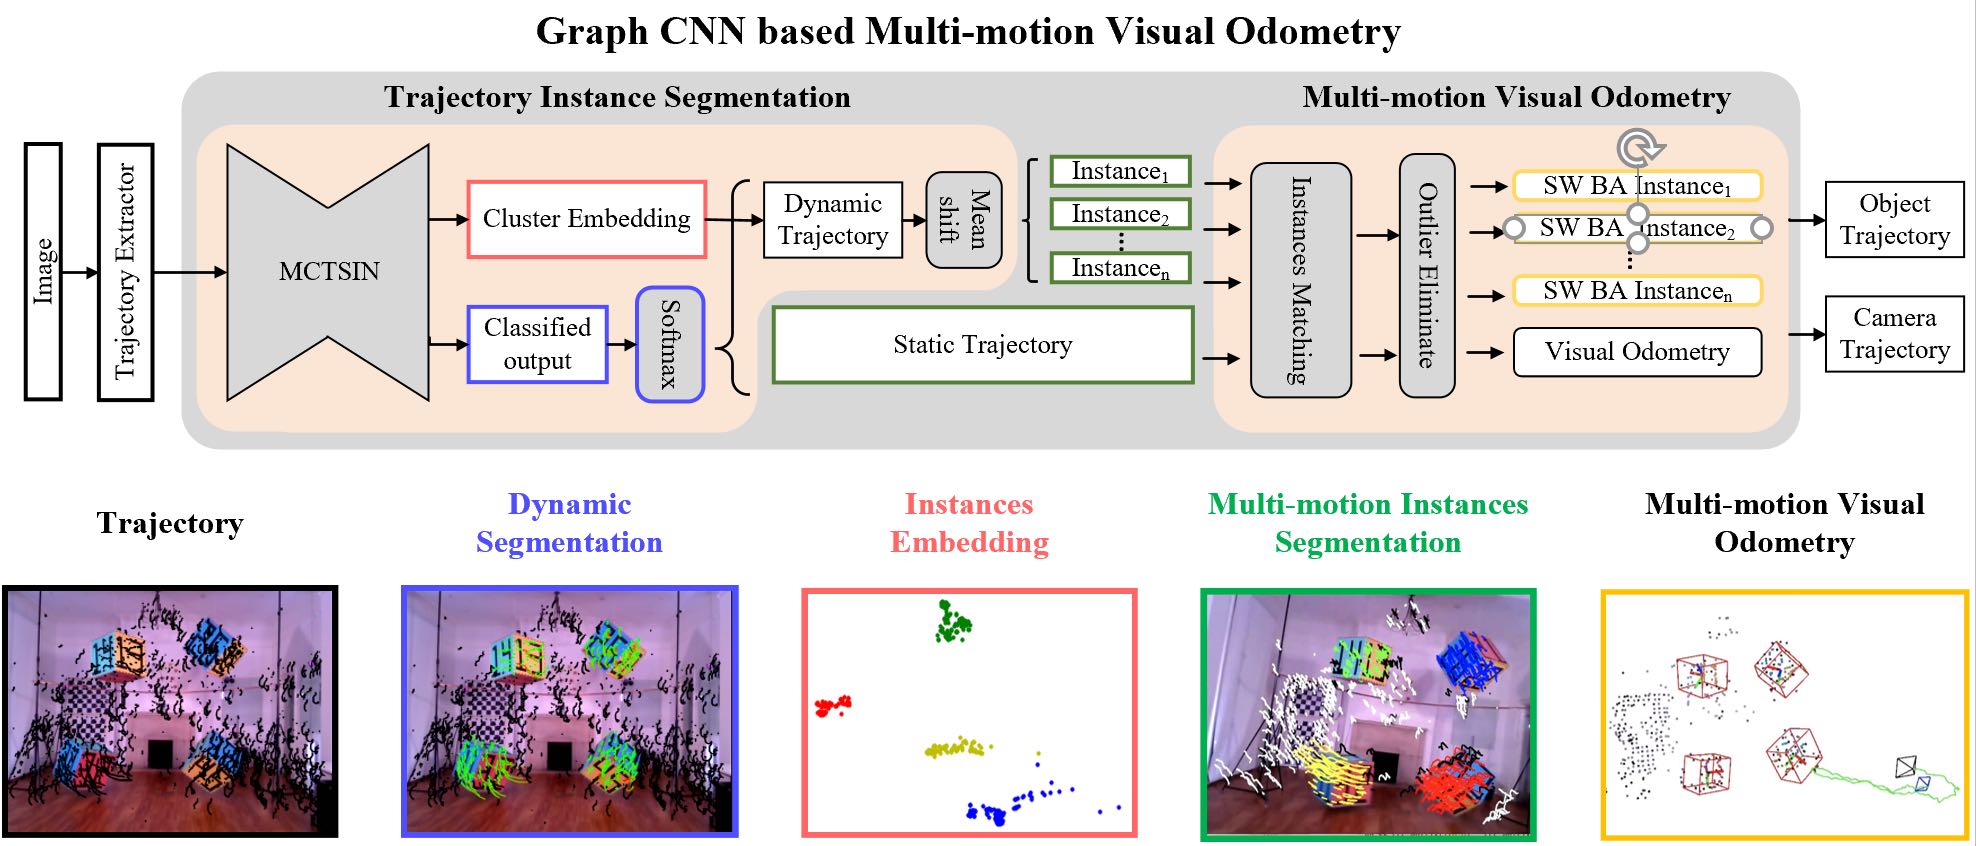
This article divides the system into two parts. The first part uses ADGCNN (Attention based Dynamic Graph CNN for Trajectories Instances Segmentation) to perform dynamic and static segmentation of the trajectory, extract the trajectory belonging to the dynamic object, and output the coding information of this part of the trajectory for clustering. After the Meanshift, the output Trajectories of characteristic points belonging to each independent rigid body. In the second part, for each instance trajectory group output in the previous stage, the space-time dual-track visual odometer is used to solve the trajectory information of the motion instance and the odometry of robot.
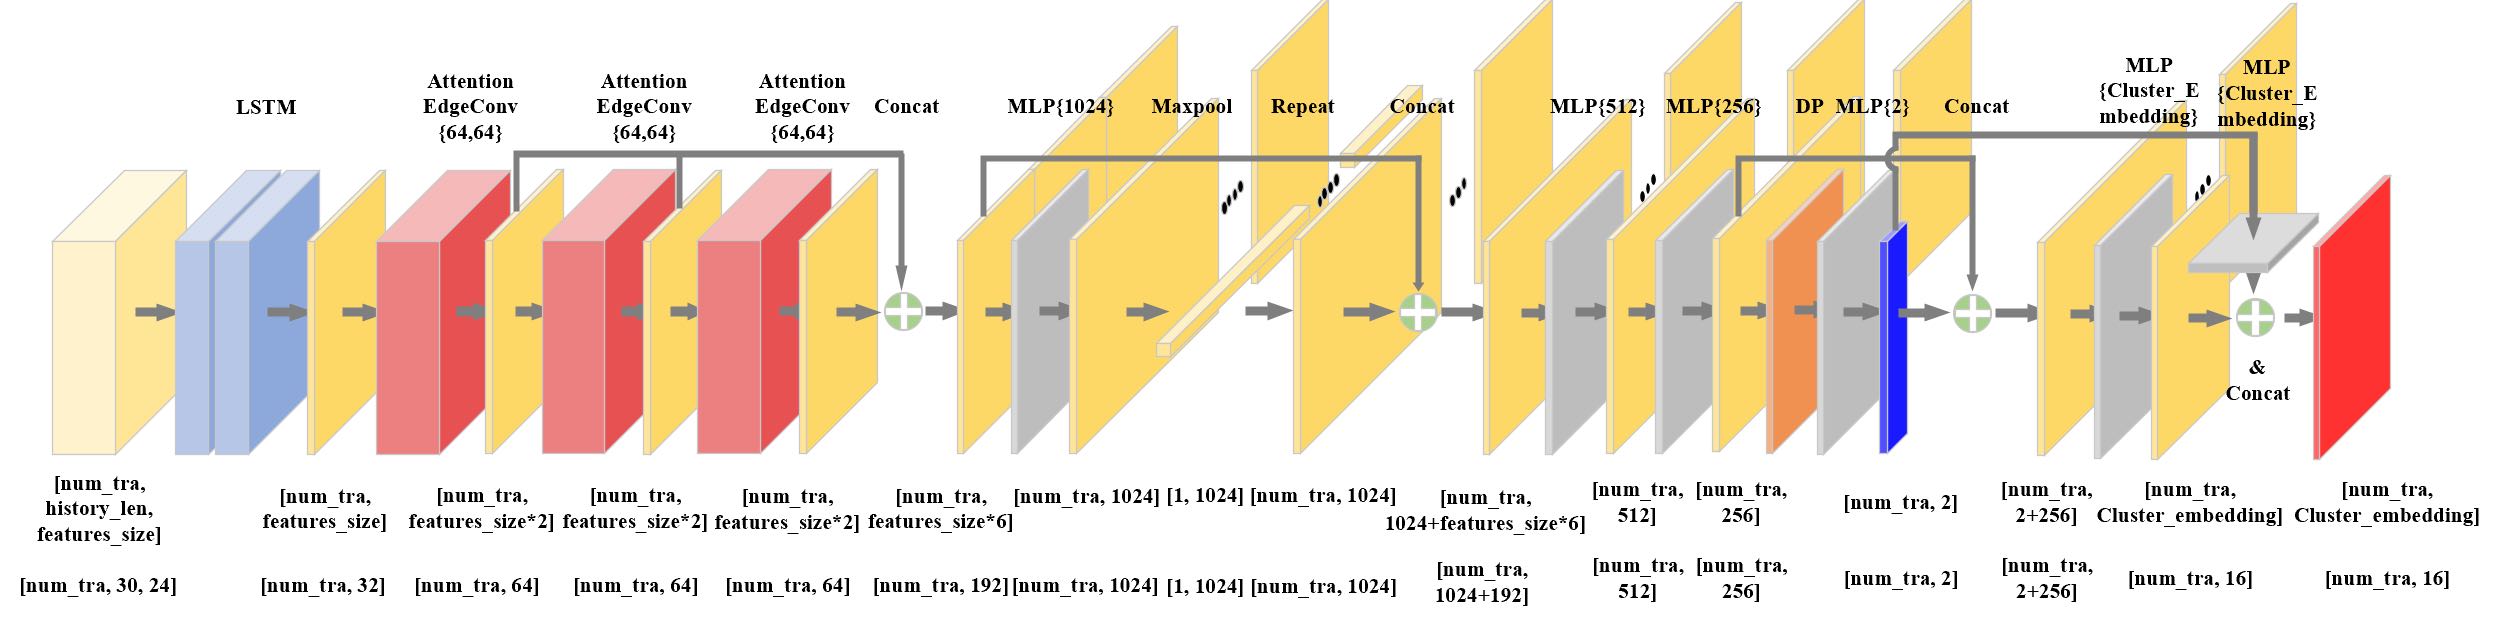
In the research process of ADGCNN in the first part of this system, this paper uses LSTM to extract the time domain features of the trajectory. And we introduce a self-attention mechanism on the basis of EdgeConv, which accelerates the aggregation of adjacent trajectory features by weighting the central node, and outputs the features of adjacent nodes aggregated by the central node to the next network.
Finally, the trajectory features are aggregated through a series of MLP layers, and Softmax is used to output the probability that the relevant nodes belong to the dynamic and static trajectories. And use Discriminative loss to train an embedding for each node, so that the dynamic trajectory is divided into instances through the clustering algorithm, and the trajectories with different motion consistency are grouped to facilitate the calculation of the instance trajectory and camera odometer at the back end.
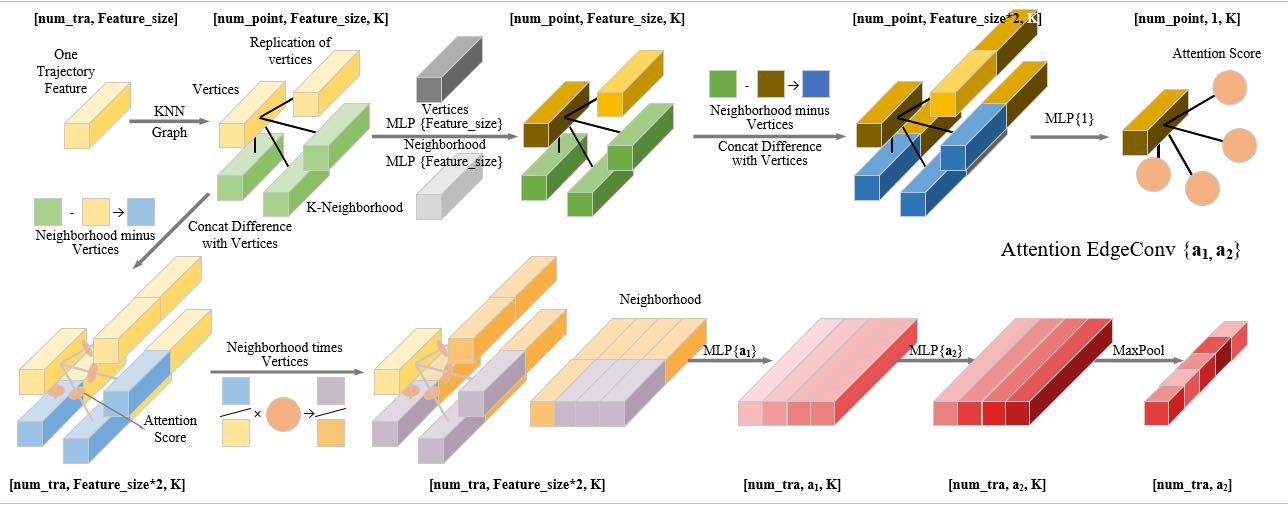
For Attention EdgeConv in ADGCNN, this part first calculates the cos distance between the central node and other nodes, solves the k neighboring nodes of the central node, and calculates additional weights for each node to indicate the importance of the corresponding node to the central node. Then, use the calculated weights to weight the corresponding nodes and concat with the central node. After MLP and Max Pool, the central node's aggregated features are output.
This article is tested on the OMD and KITTI data sets. Due to the dynamic graph convolution scheme, the distance between the central node and other nodes will continue to converge in the direction expected by the true value. Then the trajectories with similar motion can be connected together by simple sorting.
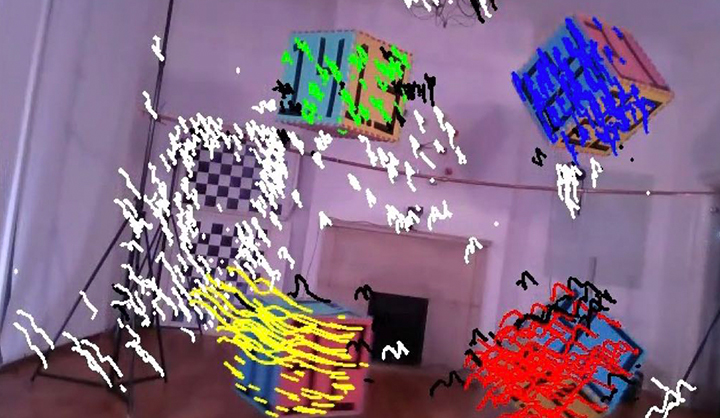
Therefore, in this part of the experiment, by characterizing the distance between the central node and other nodes, to show the effect of each part of the algorithm described in this article. The red dot in the figure below represents the central trajectory currently being tested. The cos distance of other trajectories relative to the central node is indicated by color. The lighter the color, the closer to the central node, the higher the similarity between the two trajectories; It means that the farther away from the central node, the lower the similarity between the two trajectories.
Figure OMD
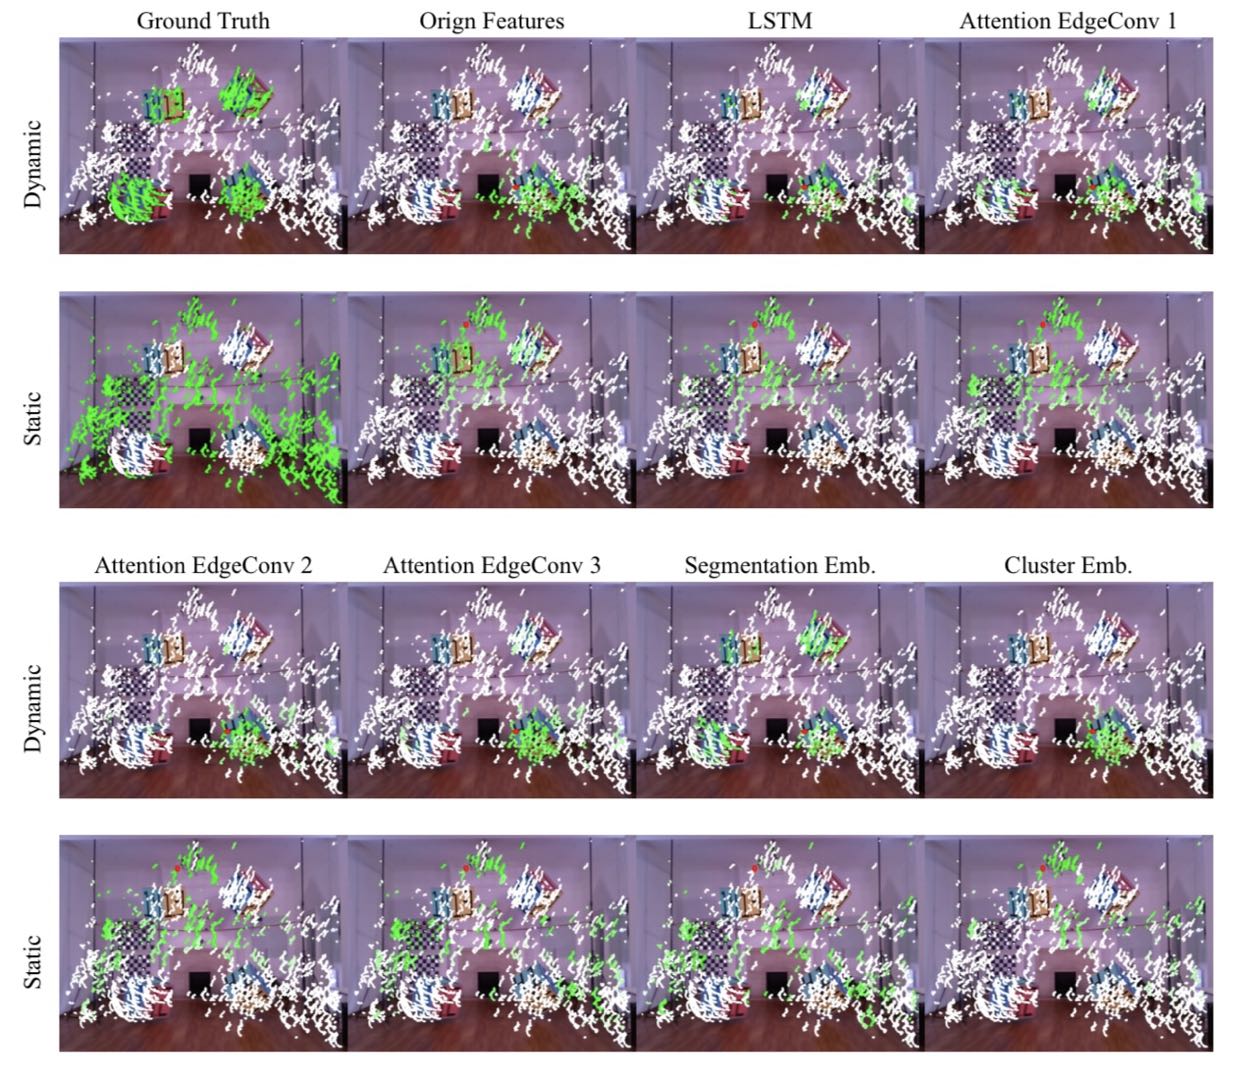
In this article, the pixel coordinates, spatial coordinates and color changes of the trajectory are used as basic features. The first-order difference, the second-order difference, and the normalized data of the basic feature in the timing sequence are used as the original feature of the trajectory.
In the test of the OMD data set, it can be seen that the dynamic and static trajectories cannot be distinguished according to the original characteristics of the trajectory. The original data more represents the Euclidean distance of the trajectory, and the characteristic distance between the peripheral trajectory and the central node is gradually reduced from the central node outwards.
After passing through an LSTM, the distance between the trajectory features can initially characterize the consistency of the trajectory. The LSTM distances of other trajectories relative to the static center trajectory still show a linear distribution on the Euclidean distance. The dynamic trajectory part is far away from the static center point. If only the k trajectories closest to the center node are taken, the static trajectory will not be connected to the dynamic trajectory. However, the classification accuracy of the features extracted by LSTM on the dynamic trajectory is low, and the distance between the LSTM features of some static trajectories and the dynamic center trajectory is relatively close.
In the subsequent iteration of the weighted dynamic graph convolutional neural network, it can be seen that among the features generated in the first iteration, there is a higher similarity between the dynamic trajectory and the static trajectory of the background.
After the next two iterations, this similarity is more able to characterize the consistency of motion, and the trajectories with a lower distance from the center node are more distributed around the center trajectory, and belong to the same rigid body, such as Attention EdgeConv 3 Dynamic output.
After the processing of several subsequent MLP layers, the feature distance represented by the Segmentation Emb. layer can be seen that the nodes with similar features to the dynamic red node are more dynamic trajectories. Nodes that are closer to the static red node feature are distributed more scattered, and more can represent the concept of "background trajectory".
After the subsequent clustering MLP encoding, the output features can better represent the object's motion consistency, and the distance between the red center trajectory and the trajectory with the same rigid body motion consistency trajectory is smaller. The trajectories obtained by the feature clustering belong to the same moving object.
Figure KITTI
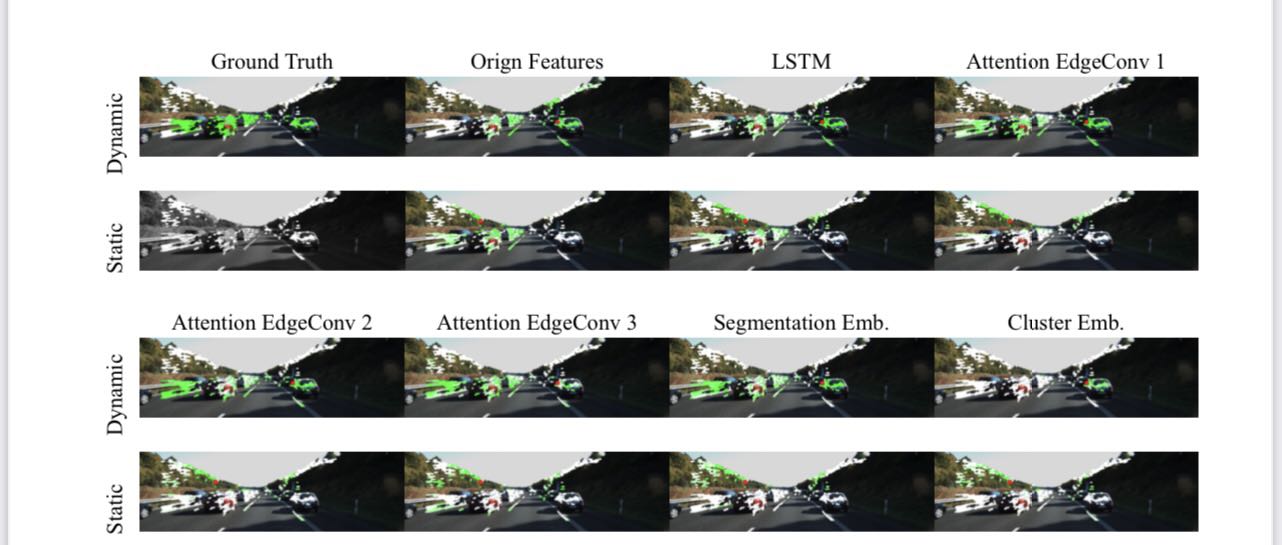
The performance of the algorithm in this paper on the KITTI data set is similar to that of the OMD data set. Through successive iterations of the algorithm in this paper, the characteristics of the consistency of the trajectory movement can be output.
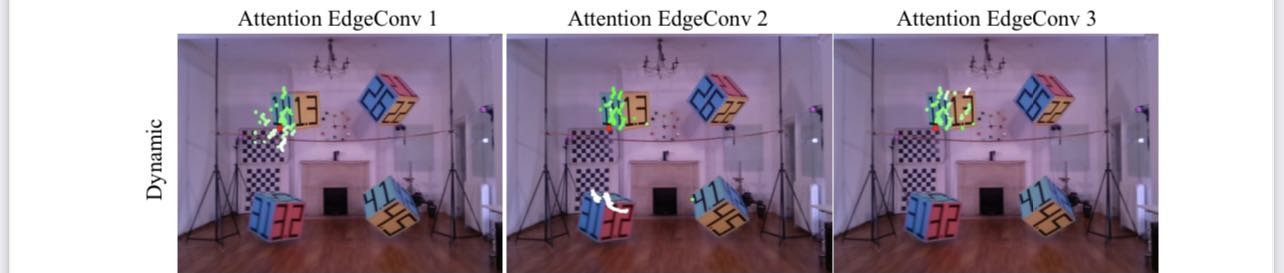
In the algorithm of this paper, the 30 nodes closest to the feature of the central node are selected as the neighborhood of the central trajectory. Same as the figure above, the central node is represented by a red dot, and its neighborhood is drawn in the same figure. The colors of other trajectories represent the importance (weight) of the node relative to the central node at this stage.
It can be seen that in the x1 process, because the features used by the center node to select the neighborhood are output by LSTM, it cannot better reflect the motion consistency, and the trajectory with similar motion consistency to the center node may not be able to reach the preset Number of neighborhoods.
However, through the evaluation of the additional attention weight, the trajectory that is less consistent with the red trajectory is assigned a lower weight. When the central node converges on the neighboring nodes, the features of the nodes in this part will be less centered. Converged by nodes. The trajectory that does not have the same motion consistency with the center trajectory is given extremely low weight, and it is basically white in the image.
Figure Attention
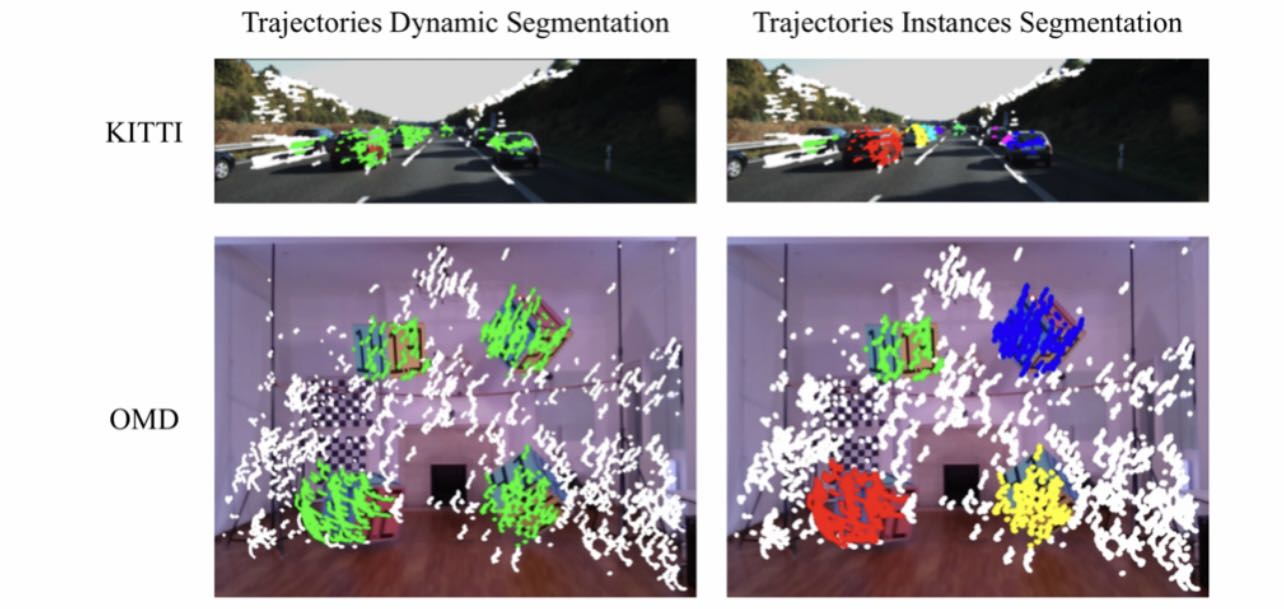
After the trajectory is sent to the network, Segmentation Embedding and Cluster Embedding can be output externally. After Segmentation Embedding is sent to Softmax, the trajectory classification probability can be output and used for dynamic classification. Send Cluster Embedding to MeanShift, and output trajectories with the same motion consistency.
The output effect diagram of ADGCNN is shown in the figure. The algorithm in this paper can achieve 93% Accuracy and 90% Balance Accuracy on the OMD data set, and can achieve 90% Accuracy and 82% Balance Accuracy on the KITTI data set.
Figure ADGCNN
Finally, through the BA algorithm of feature points, and comprehensively estimate the camera odometer and dynamic object trajectory on the time sliding window and the space sliding window, the corresponding information can be output.
Panlong Gu
Postgraduate Student of Control Engineering
My research interests include mobile robotics, Visual SLAM, 3D Target Detection and Tracking, Fusion of SLAM and target detection